| Journal of Clinical Question. 2026; 3(4): e373 https://doi.org/10.69854/jcq.2026.0025 Advance access publication date 31 August 2026 |
 |
Review Article
Heterogeneity in Meta-Analysis: Concepts, Quantification, Exploration, and Clinical Interpretation

1Department of Pulmonology, Yokohama City University, Yokohama, Japan.
2Department of Clinical and Health Informatics, UTHealth Houston, Houston, TX 77030, USA.
*Corresponding Author: e-mail: chinsmd@gmail.com
Submitted: June 21, 2026 Accepted: August 31, 2026
Clinical Question Box
How should heterogeneity be interpreted when applying meta-analysis findings to clinical practice?
Heterogeneity is one of several factors that determine whether a pooled meta-analytic estimate is clinically meaningful. Interpretation should integrate the magnitude and direction of the effect, uncertainty around the estimate, clinical relevance, risk of bias, applicability, and clinical, methodological, and statistical heterogeneity. Reviewers should assess differences in populations, interventions, comparators, outcomes, study designs, and risk of bias, together with statistical measures such as I2, τ2, and, when appropriate, prediction intervals. Potential sources of heterogeneity should be explored using prespecified subgroup analyses or meta-regression, supported by sensitivity analyses. When study effects vary substantially in magnitude or direction, the pooled estimate should not be interpreted in isolation, and its applicability to individual patients should be assessed cautiously.
Abstract
Heterogeneity is a central consideration in meta-analysis because included studies commonly differ in populations, interventions, comparators, outcome definitions, study conduct, and risk of bias. This narrative methodological review summarizes the conceptual basis, statistical assessment, exploration, and reporting of heterogeneity in pairwise meta-analysis. Clinical and methodological diversity should be assessed before pooling, whereas statistical heterogeneity is evaluated from the study-specific results during quantitative synthesis. Cochran’s Q statistic, the I2 statistic, between-study variance (τ2), and prediction intervals provide complementary rather than interchangeable information. Fixed-effect models assume a common underlying effect, whereas random-effects models estimate an average effect across a distribution of true effects and require careful interpretation. Heterogeneity should be anticipated, interpreted in a clinical context, and transparently reported rather than treated solely as a statistical nuisance. Meta-analysts should avoid rigid I2 thresholds, report τ2 and prediction intervals where feasible, distinguish effect modification from bias, and consider whether a pooled estimate remains clinically meaningful.
Keywords: Meta-analysis, heterogeneity, I2 statistic, random-effects model, prediction interval, evidence synthesis.
Introduction
Meta-analysis quantitatively synthesizes effect estimates from multiple studies to obtain an overall estimate of an intervention effect while considering the characteristics and variability of the contributing studies. Increased statistical precision may be a consequence of this synthesis, but it is not its defining purpose.1 Contemporary guidance for systematic reviews emphasizes that synthesis should be planned, transparent, and clinically interpretable, with statistical findings considered alongside the design and context of the contributing studies.2,3
Studies included in a systematic review rarely represent identical experiments. Differences in patient characteristics, disease severity, intervention dose or schedule, comparator choice, outcome definition, follow-up duration, study conduct, and risk of bias may all affect observed results.4 Heterogeneity refers to variability among study results beyond that expected from within-study sampling error alone. It is often categorized into clinical heterogeneity, methodological heterogeneity, and statistical heterogeneity.5
The presence of heterogeneity does not necessarily invalidate a meta-analysis. For many clinical questions, variability in treatment effects is expected and may provide important information about the circumstances in which an intervention is most or least effective.6 Conversely, substantial unexplained heterogeneity may render a single pooled estimate clinically uninformative or potentially misleading. Heterogeneity should therefore be treated as an issue of clinical interpretation and external validity, not only as a statistical problem. For example, variation may be expected when a treatment effect differs by biomarker status or treatment line, or when a similar relative effect translates into substantially different absolute benefits because baseline risk differs across populations.7 In such settings, heterogeneity may reveal clinically meaningful effect modification and improve the applicability of the synthesis rather than invalidate it.
Review Approach and Literature Selection
This article was designed as a narrative methodological review rather than a systematic review addressing a specific intervention or diagnostic question. The literature base was assembled through a targeted, non-exhaustive search for established evidence-synthesis guidance and key methodological publications relevant to heterogeneity in meta-analysis. Priority was given to sources addressing the conceptual classification of heterogeneity; fixed-effect and random-effects models; Cochran’s Q; I2 and τ2 statistics; prediction intervals; subgroup analysis and meta-regression; influence diagnostics; small-study effects; and certainty-of-evidence assessment. Sources were selected on the basis of their methodological relevance and synthesized narratively; no de novo quantitative synthesis was undertaken. Relevant reporting principles, together with guidance from the Cochrane Handbook and the Grading of Recommendations Assessment, Development and Evaluation (GRADE) framework, were applied where appropriate to promote transparent reporting and interpretation of heterogeneity.2,8
Conceptual Framework of Heterogeneity
Before undertaking a meta-analysis, investigators should assess whether the included studies address a sufficiently similar clinical question. This assessment should begin with the Population, Intervention, Comparator, and Outcome (PICO) framework and should precede any decision to pool results.9 Clinical and methodological diversity refer to underlying differences in study characteristics. Statistical heterogeneity refers to variability in study-specific effect estimates beyond that expected from within-study sampling error. Although conceptually distinct, statistical heterogeneity may reflect underlying clinical or methodological differences between studies. It may also arise from bias, data extraction or analysis errors, residual random variation, or the inappropriate combination of clinically incompatible studies.
Clinical Heterogeneity
Clinical heterogeneity is present when studies differ in population, intervention, comparator, outcome, or care-setting characteristics that may alter the expected treatment effect or its clinical meaning.10 Relevant features include baseline risk and disease severity, age and comorbidity, biomarker or molecular subtype, treatment line, intervention dose, intensity, or duration, co-interventions, comparator choice, outcome definition, follow-up duration, and healthcare setting. Prognostic factors are characteristics associated with the underlying risk of an outcome, whereas effect modifiers are characteristics for which the relative intervention effect differs across levels of the characteristic. Two populations may experience different absolute benefits despite similar relative effects because their baseline risks differ, whereas a biomarker or treatment-line interaction may produce genuinely different relative effects.11
Clinical heterogeneity should be assessed before pooling by comparing the PICO elements and determining whether observed differences are plausible effect modifiers or materially change the interpretation of the outcome.12 A low I2 value does not establish clinical similarity, particularly when few studies are available or estimates are imprecise. Clinical heterogeneity does not always preclude pooling when an average effect remains meaningful. However, when differences among studies are likely to modify treatment effects, separate or subgroup analyses may be more appropriate than a single pooled estimate.13
Methodological Heterogeneity
Methodological heterogeneity arises from differences in study design, conduct, analysis, or risk of bias that may contribute to differences in observed effect estimates and thereby to statistical heterogeneity, independently of true clinical differences.4 Examples include differences in study design, randomization and blinding, outcome assessment, analysis populations, handling of missing data and protocol deviations, follow-up duration, selective reporting, and other sources of bias.14 Methodological differences may contribute to observed differences in effect estimates and therefore to statistical heterogeneity, but methodological and statistical heterogeneity remain conceptually distinct. For example, studies with inadequate allocation concealment or differential outcome ascertainment may systematically yield different effect estimates from studies with more rigorous methods.
Assessment should begin with a design-specific evaluation of risk of bias and identification of methodological features that could plausibly influence the effect estimate. Studies with fundamentally different designs should not be pooled automatically simply because they address the same PICO question.15 When pooling is clinically appropriate, robustness can be assessed using sensitivity analyses that exclude studies at high risk of bias, separate analyses by study design, alternative analytical assumptions, or prespecified meta-regression of relevant methodological characteristics.16 Such analyses should be hypothesis-driven and interpreted cautiously, particularly when few studies are available, because study-level associations may have low statistical power and are susceptible to ecological bias.17 Clinical and methodological heterogeneity should therefore be considered before statistical heterogeneity is quantified. Statistical heterogeneity is a signal requiring explanation, not a diagnosis of its underlying cause.11
Statistical Framework and Pooling Models
For k studies (i = 1, ..., k), let denote the estimated intervention effect in study , with within-study variance :
The within-study variances, or their estimates, are typically treated as known or fixed when fitting the conventional random-effects model.
For binary and time-to-event outcomes, may be the natural logarithm of a risk ratio, odds ratio, or hazard ratio. For continuous outcomes, may be a mean difference or standardized mean difference.18
Fixed-Effect Model
A fixed-effect model assumes that all studies estimate one common true intervention effect, θ:
The inverse-variance weight for each study is:
The pooled fixed-effect estimate is:
with variance:
The fixed-effect model may be appropriate when the studies are considered homogeneous and when the assumption of a common underlying effect is clinically defensible. It should not be selected solely because a heterogeneity test is nonsignificant.19
Random-Effects Model
A random-effects model assumes that each of k studies estimates a different but related true effect. In the conventional model, the study-specific true effects are treated as exchangeable draws from a common distribution. A normal distribution is a convenient and commonly used modeling choice rather than an inherent property of random-effects meta-analysis; alternatives include t-distributions, skewed distributions, mixture distributions, and nonparametric distributions. Under the conventional normal specification:
Here, μ is the center of the random-effects distribution and is interpreted as the mean treatment effect, whereas τ2 is the variance of that distribution and represents the between-study variance that quantifies statistical heterogeneity.
Thus,
The random-effects weight is:
The pooled random-effects estimate is:
A random-effects model incorporates between-study variation into the weighting scheme. However, it does not explain heterogeneity, resolve clinical incompatibility, or eliminate bias. Even an estimate that is appropriately estimated under the assumed random-effects model may be clinically inappropriate when studies differ substantially in direction or clinical implication.20
Quantifying Statistical Heterogeneity
Visual inspection of a forest plot is an essential first step in assessing statistical heterogeneity. The relative positions and overlap of study 95% confidence intervals, together with the magnitude, direction, and precision of study-specific effects, can reveal inconsistency or possible outlying results that no single numerical measure fully captures.2
Cochran’s Q Statistic
Cochran’s Q statistic evaluates whether the observed variability among study estimates exceeds that expected by sampling error:
Under the null hypothesis of homogeneity, Q approximately follows a chi-square distribution with k − 1 degrees of freedom, where k is the number of studies.21 The test has limited power when few studies are available and excessive power when many studies are included. A nonsignificant Q test should not be interpreted as evidence that heterogeneity is absent. Cochran’s Q tests whether the variation in effect estimates is compatible with homogeneity, but it does not measure the magnitude or clinical importance of heterogeneity. It should therefore be interpreted alongside other measures of heterogeneity and should not be used alone to choose between fixed-effect and random-effects models.22
I2 Statistic
The I2 statistic quantifies the proportion of observed variation attributable to between-study heterogeneity rather than sampling error:
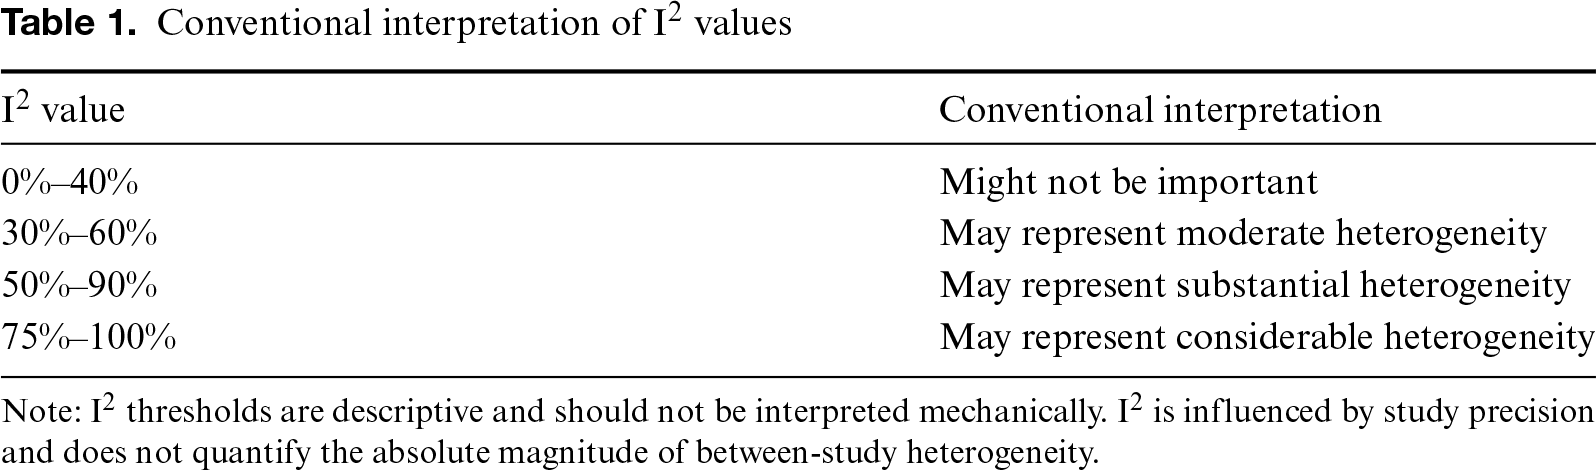
Conventional I2 categories are summarized in Table 1. However, these categories should not be applied mechanically. The clinical importance of heterogeneity depends on the magnitude and direction of treatment effects, precision of the estimates, outcome type, and consequences for decision-making.23,24 I2 is best interpreted as a relative measure of inconsistency rather than an absolute measure of heterogeneity. I2 is best interpreted as a relative measure of inconsistency rather than an absolute measure of heterogeneity. Because I2 depends on within-study precision, it may increase as studies become more precise even when the underlying between-study variance remains similar; it therefore does not directly indicate how widely the true effects vary.25 I2 should therefore be interpreted alongside τ2, individual study effects, 95% confidence intervals, prediction intervals where appropriate, and the clinical and methodological context, rather than used alone to select a meta-analytic model.26
| I² value | Conventional interpretation |
|---|---|
| 0%–40% | Might not be important |
| 30%–60% | May represent moderate heterogeneity |
| 50%–90% | May represent substantial heterogeneity |
| 75%–100% | May represent considerable heterogeneity |
Note: I² thresholds are descriptive and should not be interpreted mechanically. I² is influenced by study precision and does not quantify the absolute magnitude of between-study heterogeneity.
View original table image
Between-Study Variance: τ2
The between-study variance, τ2, estimates the absolute degree of variation in true effects across studies and is expressed on the squared scale of the effect measure. A commonly used estimator is the DerSimonian–Laird estimator18:
Although computationally simple, the DerSimonian–Laird estimator may underestimate heterogeneity, particularly when the number of studies is small or heterogeneity is substantial. Restricted maximum likelihood, Paule–Mandel, and other estimators often have more favorable statistical properties in contemporary analyses.27 In contrast to I2, τ2 quantifies the absolute amount of between-study variance on the squared effect-size scale and directly influences study weights and prediction intervals in random-effects meta-analysis. It is therefore particularly useful when the magnitude of variation in true effects is clinically important. However, τ2 should not be compared directly across different effect measures or scales.28
Prediction Intervals
A 95% confidence interval around the pooled effect quantifies uncertainty in the mean intervention effect. It does not indicate the range of treatment effects that may be expected in a comparable future study or clinical setting. A prediction interval incorporates both uncertainty in the pooled effect and between-study heterogeneity29:
For ratio measures, such as odds ratios, risk ratios, and hazard ratios, the prediction interval should be calculated on the logarithmic scale and then exponentiated. Prediction intervals are particularly important when the pooled effect is statistically significant but heterogeneity is substantial. Prediction intervals should be interpreted cautiously when the number of studies is small because both the mean effect and τ2 may be imprecisely estimated. If τ2 is zero, the prediction interval reduces to the corresponding 95% confidence interval.
From a clinical perspective, the prediction interval may be more informative than I2 alone because it provides an estimate of the range of effects that could plausibly be observed in a comparable future setting. Thus, even when the pooled mean effect is statistically significant, the prediction interval may indicate that the true effect in some settings could represent little benefit, no effect, or even harm.30
In addition to the conventional prediction interval for the true effect in a new study, study-specific prediction intervals have been proposed under random-effects models. These intervals accompany empirical Bayes estimates, or equivalently best linear unbiased predictions, of study-specific true effects and can help quantify the plausible underlying effect for an individual study. However, their coverage may be inadequate when the between-study variance is small but non-zero; they should therefore be interpreted cautiously and as a complement to the conventional prediction interval and examination of clinical and methodological sources of heterogeneity.31
Cochran’s Q assesses whether the observed dispersion is greater than would be expected from sampling error alone; I2 describes the proportion of observed variation attributable to between-study heterogeneity rather than sampling error; τ2 estimates the absolute between-study variance; and the prediction interval provides a range within which the true effect in a comparable future setting is expected to lie. These measures address distinct but complementary questions and should therefore be interpreted together rather than used interchangeably.32
95% Confidence Intervals Under Random-Effects Models
Traditional random-effects meta-analysis often uses a normal approximation for 95% confidence intervals. This approach may underestimate uncertainty when the number of studies is small because τ2 is itself estimated with error. The Hartung–Knapp–Sidik–Jonkman approach provides a more conservative alternative in many settings.33,34
Let
Then,
The 95% confidence interval is:
This method may provide improved coverage of 95% confidence intervals, especially when few studies are included. Nonetheless, its performance may be unstable when study sizes differ substantially, and modified Hartung–Knapp procedures may be appropriate in selected circumstances.35
Exploring Sources of Heterogeneity
Subgroup analyses generally compare pooled effects across predefined categories of study characteristics, such as biomarker status, treatment line, study design, risk of bias, or outcome definition. These analyses should be prespecified whenever possible and interpreted using formal tests for interaction rather than comparisons of statistical significance within individual subgroups. Their power to detect genuine between-subgroup differences is often limited, particularly when few studies are available or multiple subgroups are examined.36
Meta-regression extends subgroup analysis by relating effect estimates to one or more continuous or categorical study-level covariates.37 A simple random-effects meta-regression model is:
In this model, β0 is the expected effect when the covariates equal zero; β1 and β2 are study-level regression coefficients; Xi1 and Xi2 are the values of the two study-level covariates; ui is the residual between-study random effect with variance τ2; and εi is the within-study sampling error, typically assumed to have mean zero and variance vi.
Meta-regression may be useful for exploring associations with dose, baseline risk, treatment line, follow-up duration, or trial-level methodological characteristics. However, statistical power and model stability may be limited, especially when the number of studies is small or several covariates are examined simultaneously. Meta-regression is also vulnerable to ecological bias and spurious associations because study-level relationships may not reflect individual-level treatment effect modification.37,38
When heterogeneity is hypothesized to arise from participant-level effect modifiers, aggregate-data meta-regression may be insufficient because study-level associations can differ from within-study treatment–covariate interactions. Individual participant data meta-analysis permits these interactions to be examined directly using participant-level information and can therefore better evaluate individual-level effect modification, provided that within-study and between-study information are appropriately separated.39,40
Flexible Random-Effects Models
When substantial heterogeneity remains unexplained by available study-level covariates, flexible random-effects models can be considered to relax the conventional normality assumption. Approaches based on t-distributions, skewed distributions, finite-mixture models, or Dirichlet process models may better represent heavy tails, asymmetry, or latent clusters in the distribution of true effects.41 Such models are complementary to, rather than a replacement for, investigation of clinical and methodological sources of heterogeneity; their assumptions, data requirements, convergence, and sensitivity to model specification should be examined carefully.41
Sensitivity analyses examine whether conclusions are robust to analytical decisions. Relevant approaches include excluding studies at high risk of bias, restricting analyses to randomized controlled trials, comparing fixed-effect and random-effects estimates, using alternative estimators of τ2, and applying Hartung–Knapp 95% confidence intervals.
Outliers, Influence, and Small-Study Effects
An outlier is a study whose observed effect is statistically unusual relative to the fitted model, whereas an influential study is one whose inclusion materially changes the pooled estimate, estimated heterogeneity, or model coefficients. These concepts are not interchangeable: an outlier may have little influence, and a highly precise study may be influential without being an outlier. An outlier should not be excluded merely because it changes the pooled result.42 Investigators should first evaluate potential explanations, including data extraction errors, differences in outcome definitions, patient populations, intervention implementation, or risk of bias.
Potential outliers can be screened visually in forest plots and evaluated using standardized or studentized residuals. Influence can be assessed using leave-one-out analyses, Cook’s distances, DFBETAS, covariance ratios, hat values, and changes in the pooled effect or τ2 after omitting each study. These diagnostics should prompt data verification and substantive investigation rather than automatic study exclusion.43
Small-study effects refer to a tendency for smaller studies to report larger treatment effects than larger studies. These effects may arise from publication bias, selective reporting, lower methodological quality, true differences in populations, or chance. Funnel plots and regression-based asymmetry tests may be used when sufficient studies are available, but they do not distinguish publication bias from other sources of heterogeneity.44
Heterogeneity and Certainty of Evidence
In the Grading of Recommendations Assessment, Development and Evaluation framework, unexplained inconsistency may reduce the certainty of the evidence. Downgrading should consider variability in the direction of effect, magnitude of heterogeneity, width and clinical interpretation of the prediction interval, plausibility of clinical or methodological explanations, credibility of subgroup effects, and whether heterogeneity changes the clinical conclusion.45
A high I2 value alone should not automatically lead to downgrading. Conversely, a low I2 value does not guarantee consistency when few studies are available or when 95% confidence intervals are wide.
Recommended Reporting of Heterogeneity
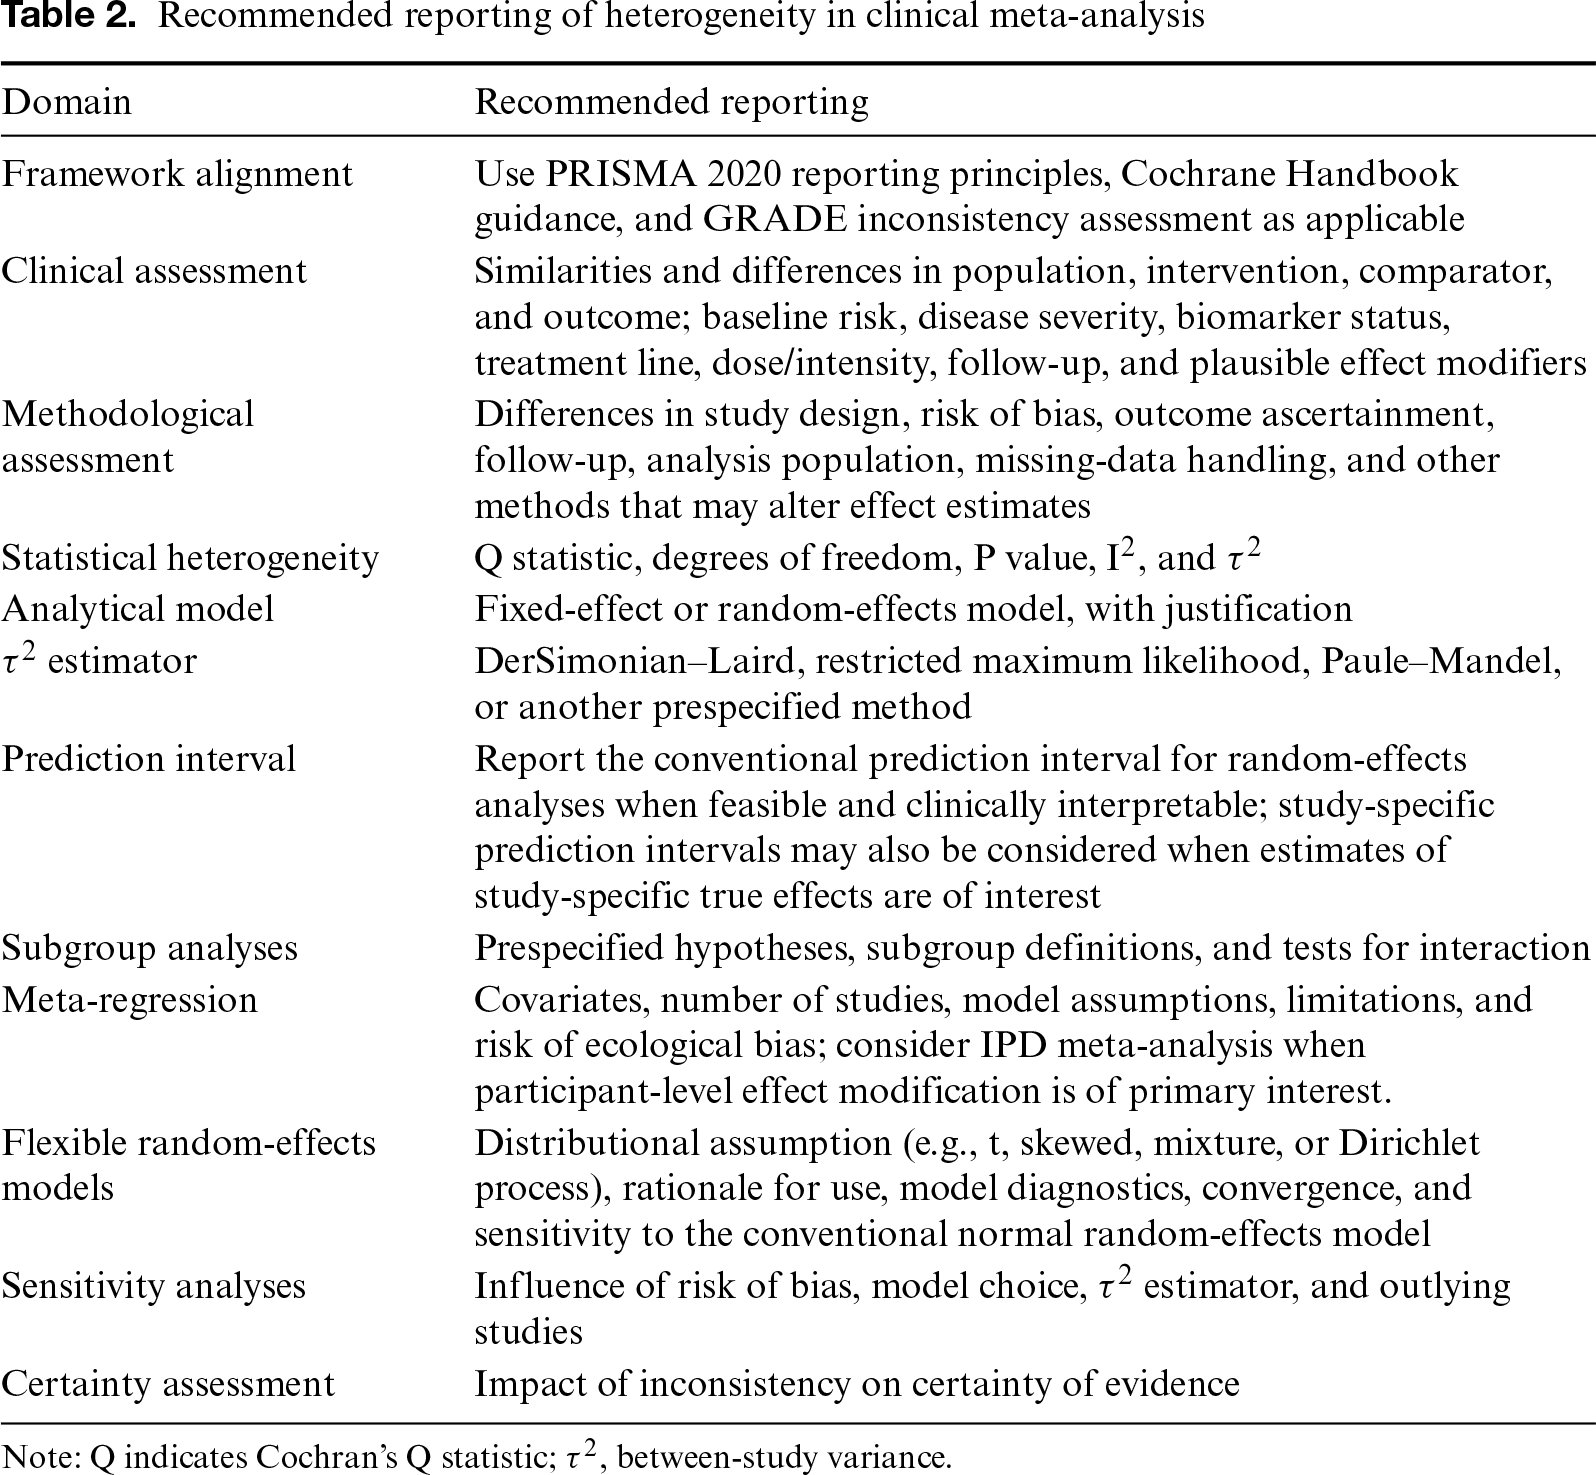
Meta-analyses should report heterogeneity transparently and in clinically meaningful terms. Recommended reporting domains are summarized in Table 2. The forest plot should be interpreted alongside heterogeneity measures, not separately. Visual assessment may reveal differences in direction of effect, study precision, or outlying results that are not captured by a single numerical statistic. These guidance frameworks provide complementary perspectives on the assessment and reporting of heterogeneity. PRISMA 2020 emphasizes transparent reporting of synthesis methods and investigations of heterogeneity3; the Cochrane Handbook provides detailed methodological guidance for assessing clinical, methodological, and statistical heterogeneity; and GRADE considers unexplained inconsistency when evaluating the certainty of evidence. Table 2 integrates these principles into a practical framework for heterogeneity assessment and reporting. Beyond statistical measures, reports should describe the clinical and methodological rationale for pooling, justify the choice of analytical model and τ2 estimator, report prediction intervals when appropriate, distinguish prespecified analyses from post hoc exploration, and explain how heterogeneity influences the certainty and applicability of the evidence.28,46
| Domain | Recommended reporting |
|---|---|
| Framework alignment | Use PRISMA 2020 reporting principles, Cochrane Handbook guidance, and GRADE inconsistency assessment as applicable |
| Clinical assessment | Similarities and differences in population, intervention, comparator, and outcome; baseline risk, disease severity, biomarker status, treatment line, dose/intensity, follow-up, and plausible effect modifiers |
| Methodological assessment | Differences in study design, risk of bias, outcome ascertainment, follow-up, analysis population, missing-data handling, and other methods that may alter effect estimates |
| Statistical heterogeneity | Q statistic, degrees of freedom, P value, I², and τ² |
| Analytical model | Fixed-effect or random-effects model, with justification |
| τ² estimator | DerSimonian–Laird, restricted maximum likelihood, Paule–Mandel, or another prespecified method |
| Prediction interval | Report the conventional prediction interval for random-effects analyses when feasible and clinically interpretable; study-specific prediction intervals may also be considered when estimates of study-specific true effects are of interest |
| Subgroup analyses | Prespecified hypotheses, subgroup definitions, and tests for interaction |
| Meta-regression | Covariates, number of studies, model assumptions, limitations, and risk of ecological bias; consider IPD meta-analysis when participant-level effect modification is of primary interest. |
| Flexible random-effects models | Distributional assumption (e.g., t, skewed, mixture, or Dirichlet process), rationale for use, model diagnostics, convergence, and sensitivity to the conventional normal random-effects model |
| Sensitivity analyses | Influence of risk of bias, model choice, τ² estimator, and outlying studies |
| Certainty assessment | Impact of inconsistency on certainty of evidence |
Note: Q indicates Cochran’s Q statistic; τ², between-study variance.
View original table image
Practical Framework for Clinical Meta-Analysts
A practical framework for clinical meta-analysts is presented in Fig. 1. Key steps include defining a clinically coherent research question using the Population, Intervention, Comparator, and Outcome framework; assessing clinical and methodological diversity before pooling; verifying data extraction, outcome direction, units of analysis, and effect-measure consistency; and quantifying statistical heterogeneity using Q, I2, and τ2. Rigid interpretation of I2 thresholds should be avoided, and the choice between fixed-effect and random-effects models should be guided by the scientific question and underlying assumptions. Prediction intervals should be reported for random-effects analyses where feasible. Potential sources of heterogeneity should be explored through prespecified subgroup or meta-regression analyses, supported by sensitivity and influence analyses; when substantial heterogeneity remains unexplained by available clinical or methodological characteristics, flexible random-effects models may complement these investigations. Finally, investigators should assess whether a pooled estimate remains clinically interpretable, downgrade the certainty of evidence when inconsistency is substantial, unexplained, and clinically important, and avoid presenting a pooled estimate when studies are too heterogeneous or not meaningfully comparable. The sequence of assessment is important: clinical and methodological heterogeneity should be evaluated first, because statistical measures alone cannot determine whether observed variability reflects true effect modification, methodological bias, or inappropriate pooling.
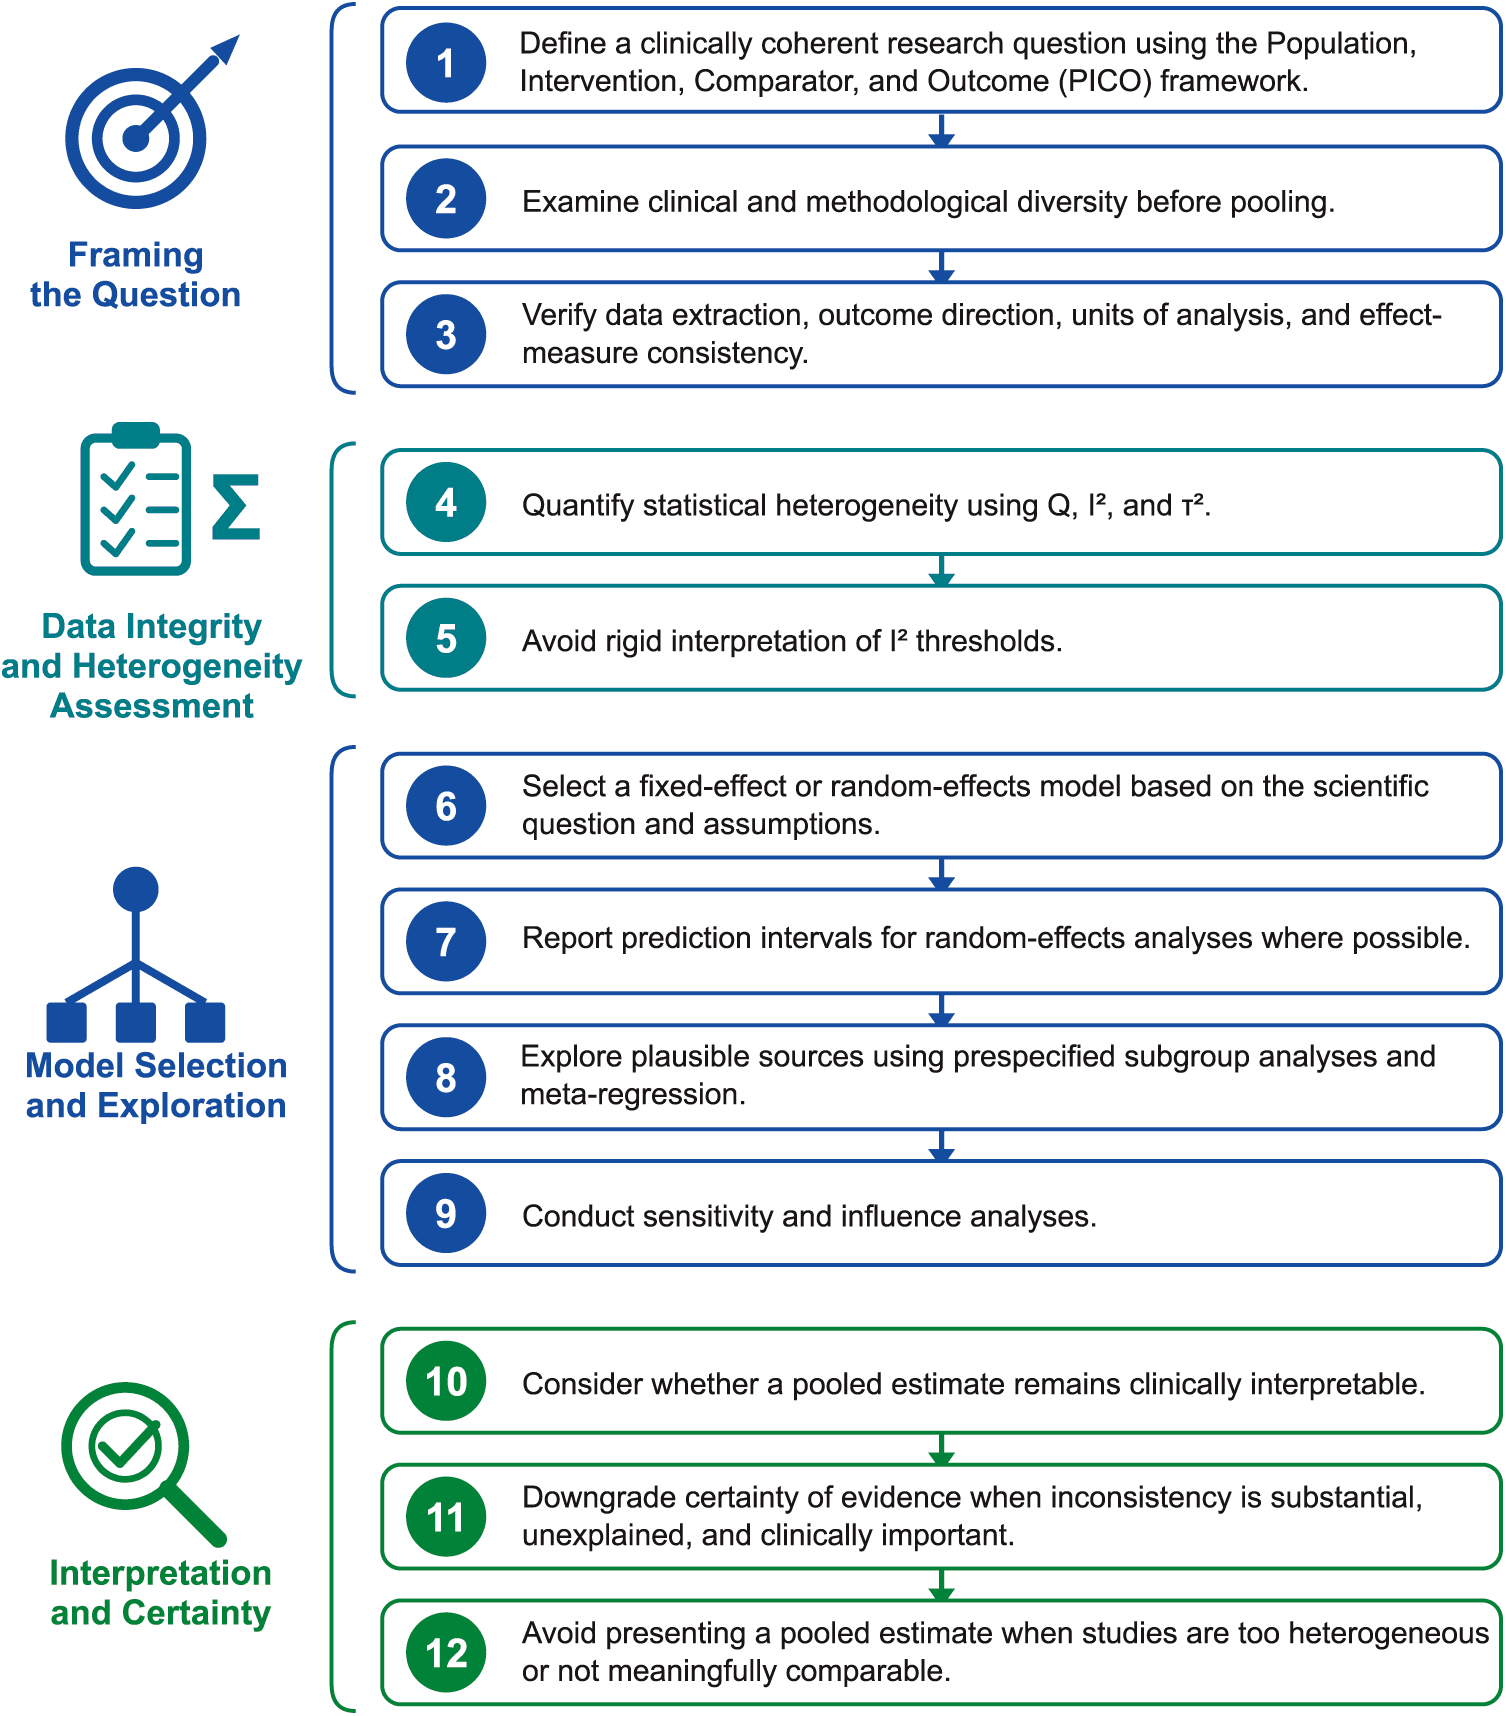
Figure 1. Practical framework for assessing and reporting heterogeneity in clinical meta-analyses.
Conclusions
Heterogeneity is an expected feature of evidence synthesis rather than an exceptional statistical problem. Its appropriate assessment requires integration of clinical reasoning, methodological appraisal, and statistical analysis. I2, τ2, Cochran’s Q, and prediction intervals should be viewed as complementary tools, each providing distinct information about between-study variation. Random-effects models are useful for estimating an average effect across heterogeneous studies, but they do not resolve clinical incompatibility or methodological bias. The most informative meta-analyses identify plausible sources of heterogeneity, evaluate the robustness of conclusions, and communicate whether the pooled estimate is likely to apply in future clinical settings. Transparent reporting of heterogeneity is essential for valid interpretation, certainty assessment, and translation of evidence into clinical practice.
Acknowledgment
Not applicable.
Funding
None.
Author Contributions
H.C. and Y.G. conceived and designed the review, conducted the literature search, selected and critically appraised the relevant literature, synthesized the evidence, developed the methodological framework, and drafted and critically revised the manuscript. H.C. and Y.G. approved the final version of the manuscript and accept full responsibility for the integrity and accuracy of the work.
Data Availability Statement
No new data were generated or analyzed in this study.
Generative AI Declaration
During revision, a generative AI tool developed by OpenAI was used to assist with language editing and organization. All substantive content and references were critically reviewed by the authors, who take full responsibility for the final manuscript.
Ethics Statement
This methodological review did not involve human participants or animals; therefore, ethics approval was not required.
Conflict of Interest
The author declares no conflicts of interest.
References
[1] Brignardello-Petersen R, Santesso N, Guyatt GH. Systematic reviews of the literature: an introduction to current methods. Am J Epidemiol. February 5, 2025;5(2):536–542. doi:10.1093/aje/kwae232.
[2] Deeks JJ, Higgins JPT, Altman DG, McKenzie JE, Veroniki AA. Chapter 10: Analysing data and undertaking meta-analyses. In: Higgins JPT, Thomas J, Chandler J, et al. (Eds.), Cochrane Handbook for Systematic Reviews of Interventions. Version 6.5. Cochrane; 2024.
[3] Page MJ, McKenzie JE, Bossuyt PM, et al. The PRISMA, 2020 statement: an updated guideline for reporting systematic reviews. BMJ. 2021;372:n71. doi:10.1136/bmj.n71.
[4] Choi GJ, Kang H. Heterogeneity in meta-analyses: an unavoidable challenge worth exploring. Korean J Anesthesiol. August 2025;78(4):301–314. doi:10.4097/kja.25001.
[5] Rosales RS, Ruettermann M. How to conduct a meta-analysis in hand surgery. Part II: heterogeneity and publication bias. J Hand Surg Eur. September 2025;50(8):1120–1128. doi:10.1177/17531934251317837.
[6] Lipkovich I, Svensson D, Ratitch B, Dmitrienko A. Modern approaches for evaluating treatment effect heterogeneity from clinical trials and observational data. Stat Med. September 30, 2024;43(22):4388–4436. doi:10.1002/sim.10167.
[7] Guyatt G, Agoritsas T, Brignardello-Petersen R, et al. Core GRADE 1: overview of the Core GRADE approach. BMJ. 2025;389:e081903. doi:10.1136/bmj-2024-081903.
[8] Schünemann H, Brożek J, Guyatt G, Oxman A, eds. Handbook for Grading the Quality of Evidence and the Strength of Recommendations Using the GRADE Approach. GRADE Working Group; Updated October 2013.
[9] Barrington MJ, D'Souza RS, Mascha EJ, Narouze S, Kelley GA. Systematic reviews and meta-analyses in regional anesthesia and pain medicine (Part I): guidelines for preparing the review protocol. Reg Anesth Pain Med. June 3, 2024;3(6):391–402. doi:10.1136/rapm-2023-104801.
[10] Murad MH, Wang Z, Falck-Ytter Y. Facilitating GRADE judgements about the inconsistency of effects using a novel visualisation approach. BMJ Evid Based Med. September 22, 2025;30(5):347–350. doi:10.1136/bmjebm-2024-113038.
[11] Riley RD, Debray TPA, Fisher D, et al. Individual participant data meta-analysis to examine interactions between treatment effect and participant-level covariates: statistical recommendations for conduct and planning. Stat Med. July 10, 2020;39(15):2115–2137. doi:10.1002/sim.8516.
[12] Gao Y, Li Z, Liu M, et al. Effect modification analyses in individual participant data meta-analyses: a systematic review. JAMA Netw Open. April 1, 2026;1 9(4):e268810. doi:10.1001/jamanetworkopen.2026.8810.
[13] Arredondo Montero J. How to interpret heterogeneity in meta-analysis: a structured guide for clinicians and researchers. BioMedInformatics. 2026;6(3):35. doi:10.3390/biomedinformatics6030035.
[14] Mathur MB, VanderWeele TJ. Methods to address confounding and other biases in meta-analyses: review and recommendations. Annu Rev Public Health. April 5, 2022;5(1):19–35. doi:10.1146/annurev-publhealth-051920-114020.
[15] Aung NM, Jurak I, Mehmood S, Axon E. Sensitivity analysis in meta-analysis: a tutorial. Cochrane Evid Synth Methods. January 2026;4(1):e70067. doi:10.1002/cesm.70067.
[16] Brini S, Leung TI. Value and credibility of meta-analysis: tutorial on enhancing methodological rigor and AI-powered efficiency. J Med Internet Res. July 2, 2026;28:e92132. doi:10.2196/92132.
[17] Geissbühler M, Hincapié CA, Aghlmandi S, Zwahlen M, Jüni P, da Costa BR. Most published meta-regression analyses based on aggregate data suffer from methodological pitfalls: a meta-epidemiological study. BMC Med Res Methodol. 2021;21(1):123. doi:10.1186/s12874-021-01310-0.
[18] DerSimonian R, Laird N. Meta-analysis in clinical trials. Control Clin Trials. 1986;7(3):177–188. doi:10.1016/0197-2456(86)90046-2.
[19] Borenstein M, Hedges LV, Higgins JP, Rothstein HR. A basic introduction to fixed-effect and random-effects models for meta-analysis. Res Synth Methods. April 2010;1(2):97–111. doi:10.1002/jrsm.12.
[20] Higgins JPT, Thompson SG, Spiegelhalter DJ. A re-evaluation of random-effects meta-analysis. J R Stat Soc: Ser A (Sta Soc). January 1, 2009;172(1):137–159. doi:10.1111/j.1467-985X.2008.00552.x.
[21] Cochran WG. The combination of estimates from different experiments. Biometrics. 1954;10(1):101–129. doi:10.2307/3001666.
[22] Yang Y, Noble DWA, Spake R, Senior AM, Lagisz M, Nakagawa S. A pluralistic framework for measuring, interpreting and decomposing heterogeneity in meta-analysis. Methods Ecol Evol. November 1, 2025;16(11):2710–2725. doi:10.1111/2041-210x.70155.
[23] Higgins JP, Thompson SG. Quantifying heterogeneity in a meta-analysis. Stat Med. June 15, 2002;21(11):1539–1558. doi:10.1002/sim.1186.
[24] Higgins JP, Thompson SG, Deeks JJ, Altman DG. Measuring inconsistency in meta-analyses. BMJ. September 6, 2003;327(7414):557–560. doi:10.1136/bmj.327.7414.557.
[25] Rücker G, Schwarzer G, Carpenter JR, Schumacher M. Undue reliance on I(2) in assessing heterogeneity may mislead. BMC Med Res Methodol. November 27, 2008;8(1):79. doi:10.1186/1471-2288-8-79.
[26] Higgins JPT, López-López JA. Reflections on the I-squared index for measuring inconsistency in meta-analysis. Res Synth Methods. May 2026;17(3):389–402. doi:10.1017/rsm.2025.10062.
[27] Veroniki AA, Jackson D, Viechtbauer W, et al. Methods to estimate the between-study variance and its uncertainty in meta-analysis. Res Synth Methods. March 2016;7(1):55–79. doi:10.1002/jrsm.1164.
[28] Borenstein M. Avoiding common mistakes in meta-analysis: understanding the distinct roles of Q, I-squared, tau-squared, and the prediction interval in reporting heterogeneity. Res Synthesis Methods. March 1, 2024;15(2):354–368. doi:10.1002/jrsm.1678.
[29] Riley RD, Higgins JP, Deeks JJ. Interpretation of random effects meta-analyses. BMJ. February 10, 2011;342:d549. doi:10.1136/bmj.d549.
[30] Mátrai P, Kói T, Sipos Z, Farkas N. Assessing the properties of the prediction interval in random-effects meta-analysis. Res Synth Methods. May 2026;17(3):517–537. doi:10.1017/rsm.2025.10055.
[31] van Aert RCM, Schmid CH, Svensson D, Jackson D. Study specific prediction intervals for random-effects meta-analysis: a tutorial: prediction intervals in meta-analysis. Res Synth Methods. July 2021;12(4):429–447. doi:10.1002/jrsm.1490.
[32] Borg DN. Meta-analysis prediction intervals are under reported in sport and exercise medicine. Scand J Med Sci Sports. 2024;34(3):1–10. doi:10.1111/sms.14603.
[33] IntHout J, Ioannidis JPA, Borm GF. The Hartung-Knapp-Sidik-Jonkman method for random effects meta-analysis is straightforward and considerably outperforms the standard DerSimonian-Laird method. BMC Med Res Methodol. 2014;14(1):25. doi:10.1186/1471-2288-14-25.
[34] Röver C, Knapp G, Friede T. Hartung-Knapp-Sidik-Jonkman approach and its modification for random-effects meta-analysis with few studies. BMC Med Res Methodol. 2015;15(1):99. doi:10.1186/s12874-015-0091-1.
[35] Jackson D, Law M, Rücker G, Schwarzer G. The Hartung-Knapp modification for random-effects meta-analysis: a useful refinement but are there any residual concerns? Stat Med. 2017;36(25):3923–3934. doi:10.1002/sim.7411.
[36] Borenstein M, Higgins JPT. Meta-analysis and subgroups. Prev Sci. 2013;14(2):134–143. doi:10.1007/s11121-013-0377-7.
[37] Thompson SG, Higgins JPT. How should meta-regression analyses be undertaken and interpreted? Stat Med. 2002;21(11):1559–1573. doi:10.1002/sim.1187.
[38] Higgins JPT, Thompson SG. Controlling the risk of spurious findings from meta-regression. Stat Med. 2004;23(11):1663–1682. doi:10.1002/sim.1752.
[39] Hua H, Burke DL, Crowther MJ, Ensor J, Tudur Smith C, Riley RD. One-stage individual participant data meta-analysis models: estimation of treatment-covariate interactions must avoid ecological bias by separating out within-trial and across-trial information. Stat Med. February 28, 2017;36(5):772–789. doi:10.1002/sim.7171.
[40] Berlin JA, Santanna J, Schmid CH, Szczech LA, Feldman HI. Individual patient- versus group-level data meta-regressions for the investigation of treatment effect modifiers: ecological bias rears its ugly head. Stat Med. February 15, 2002;21(3):371–387. doi:10.1002/sim.1023.
[41] Panagiotopoulou K, Evrenoglou T, Schmid CH, Metelli S, Chaimani A. Meta-analysis models relaxing the random-effects normality assumption: methodological systematic review and simulation study. BMC Med Res Methodol. October 16, 2025;25(1):231. doi:10.1186/s12874-025-02658-3.
[42] Kanukula R, Page MJ, Turner SL, McKenzie JE. Identification of application and interpretation errors that can occur in pairwise meta-analyses in systematic reviews of interventions: a systematic review. J Clin Epidemiol. June 1, 2024;170:111331. doi:10.1016/j.jclinepi.2024.111331.
[43] Viechtbauer W, Cheung MW. Outlier and influence diagnostics for meta-analysis. Res Synth Methods. April 2010;1(2):112–125. doi:10.1002/jrsm.11.
[44] Sterne JAC, Sutton AJ, Ioannidis JPA, et al. Recommendations for examining and interpreting funnel plot asymmetry in meta-analyses of randomised controlled trials. BMJ. 2011;343:d4002. doi:10.1136/bmj.d4002.
[45] Guyatt GH, Oxman AD, Kunz R, et al. GRADE guidelines: 7. Rating the quality of evidence–inconsistency. J Clin Epidemiol. 2011;64(12):1294–1302. doi:10.1016/j.jclinepi.2011.03.017.
[46] Guyatt G, Schandelmaier S, Brignardello-Petersen R, et al. Core GRADE 3: rating certainty of evidence—assessing inconsistency. BMJ. 2025;389:e081905. doi:10.1136/bmj-2024-081905.
 |
Copyright: © 2026 Chen and Gong This work is licensed under a Creative Commons Attribution 4.0 International License, which permits unrestricted use, distribution, and reproduction in any medium, provided the original work is properly cited. |